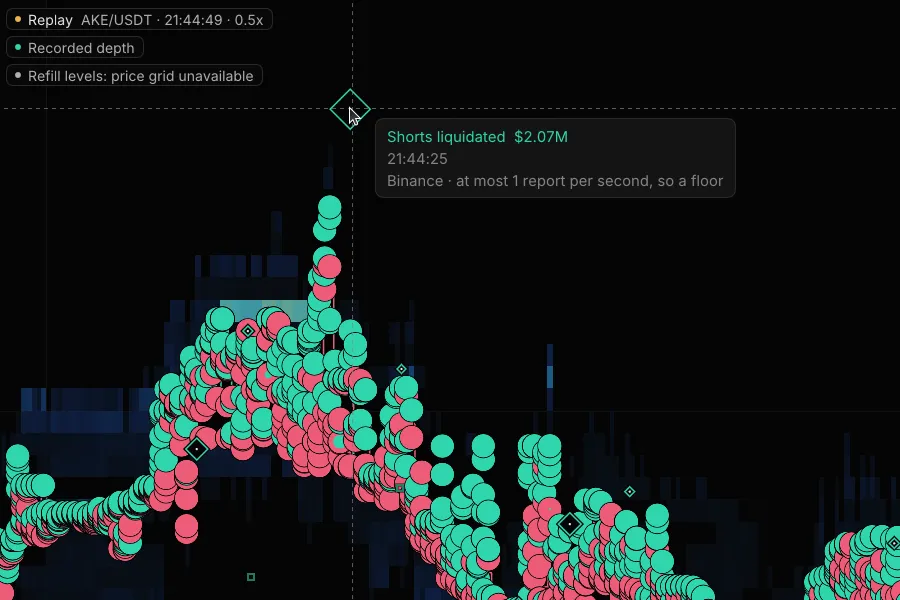
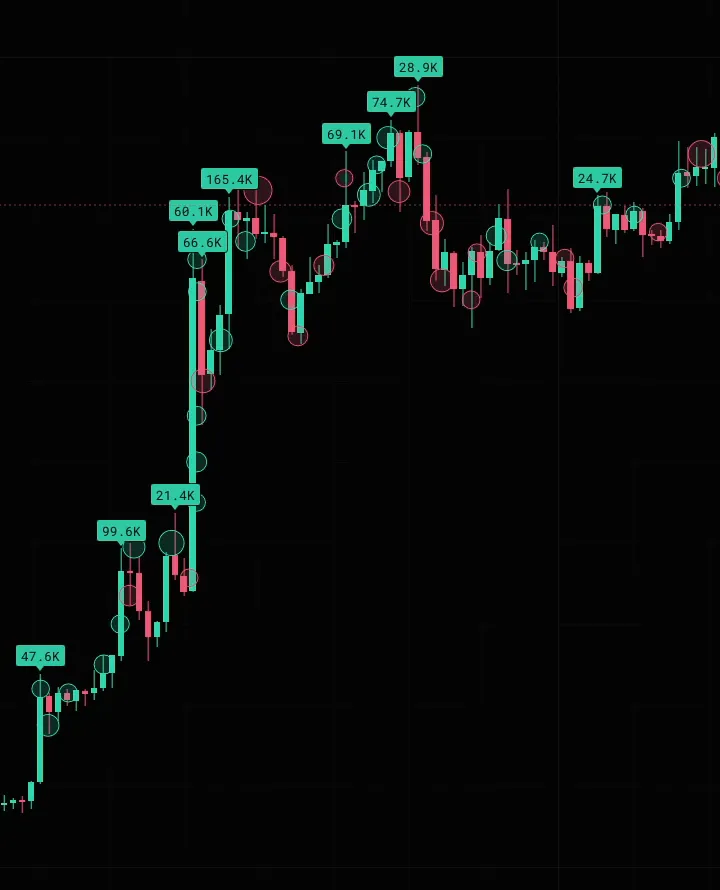



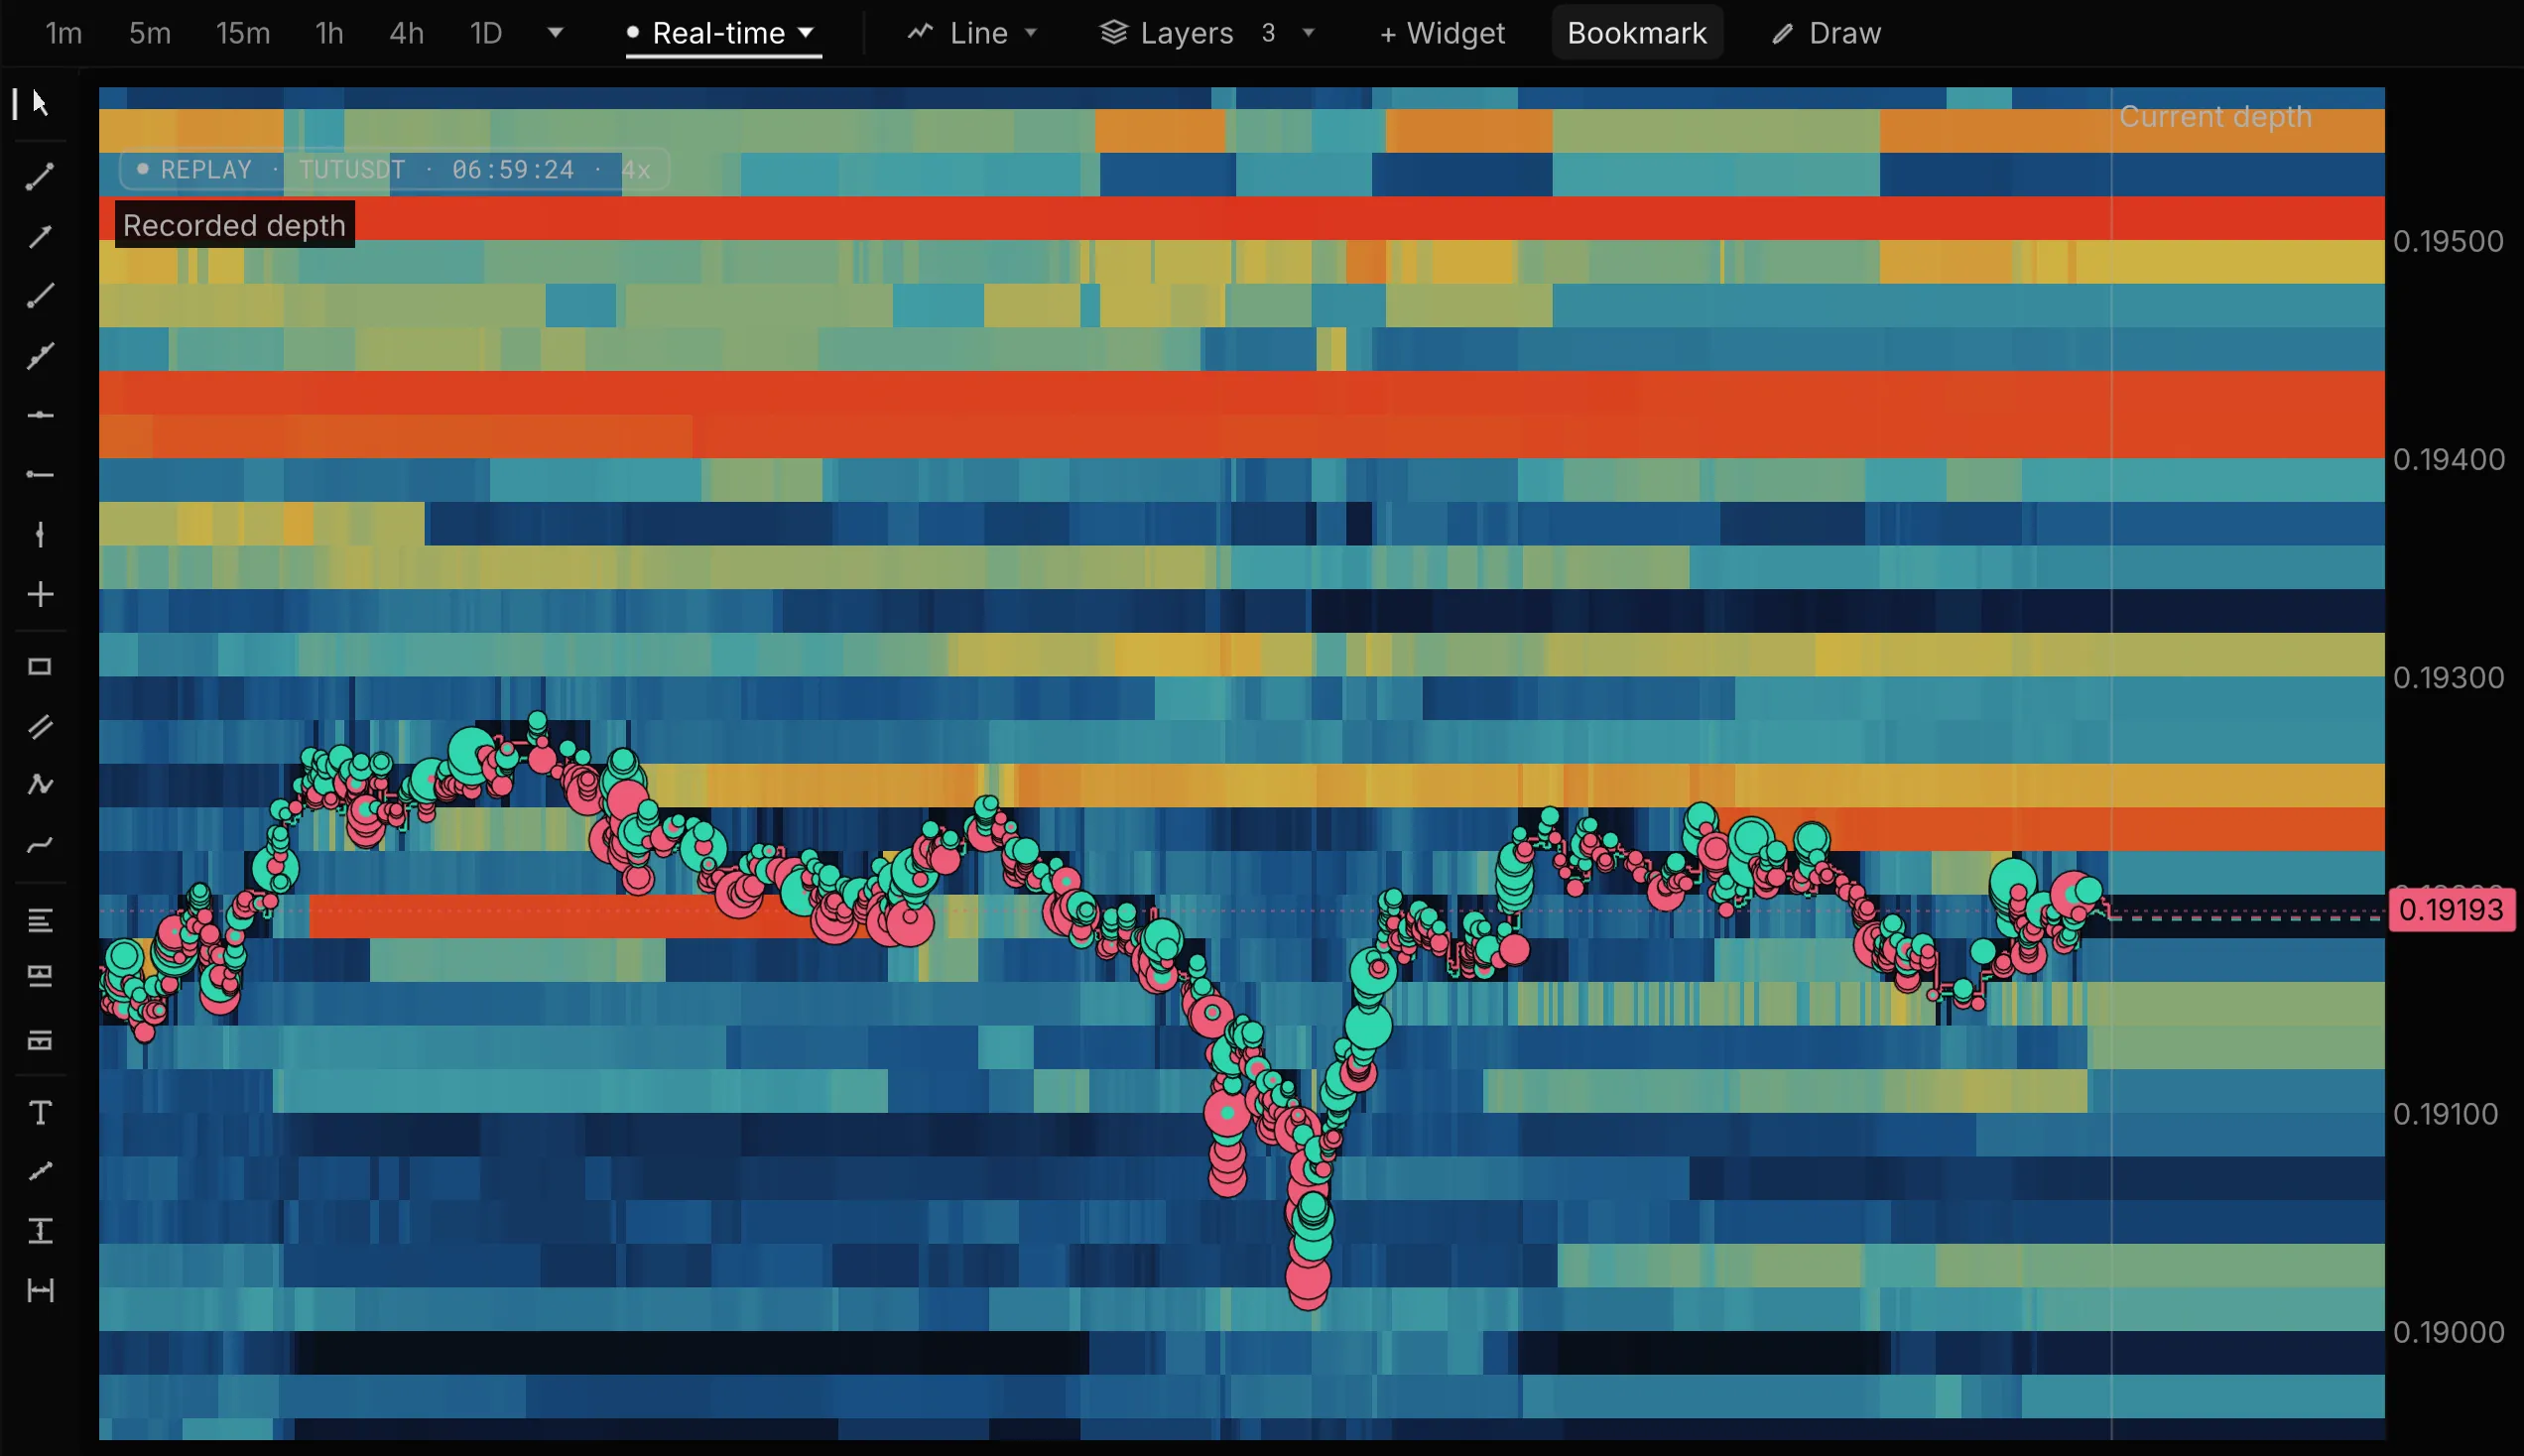
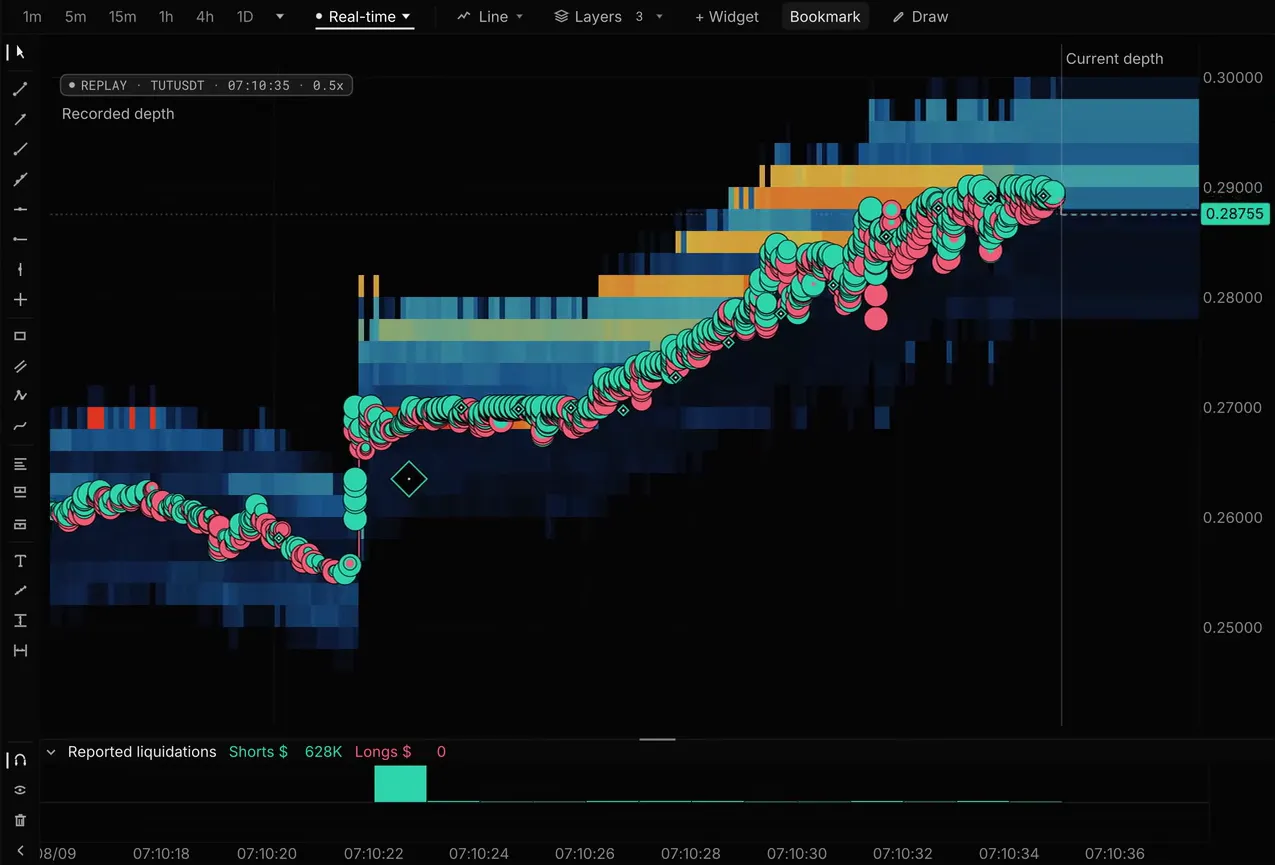
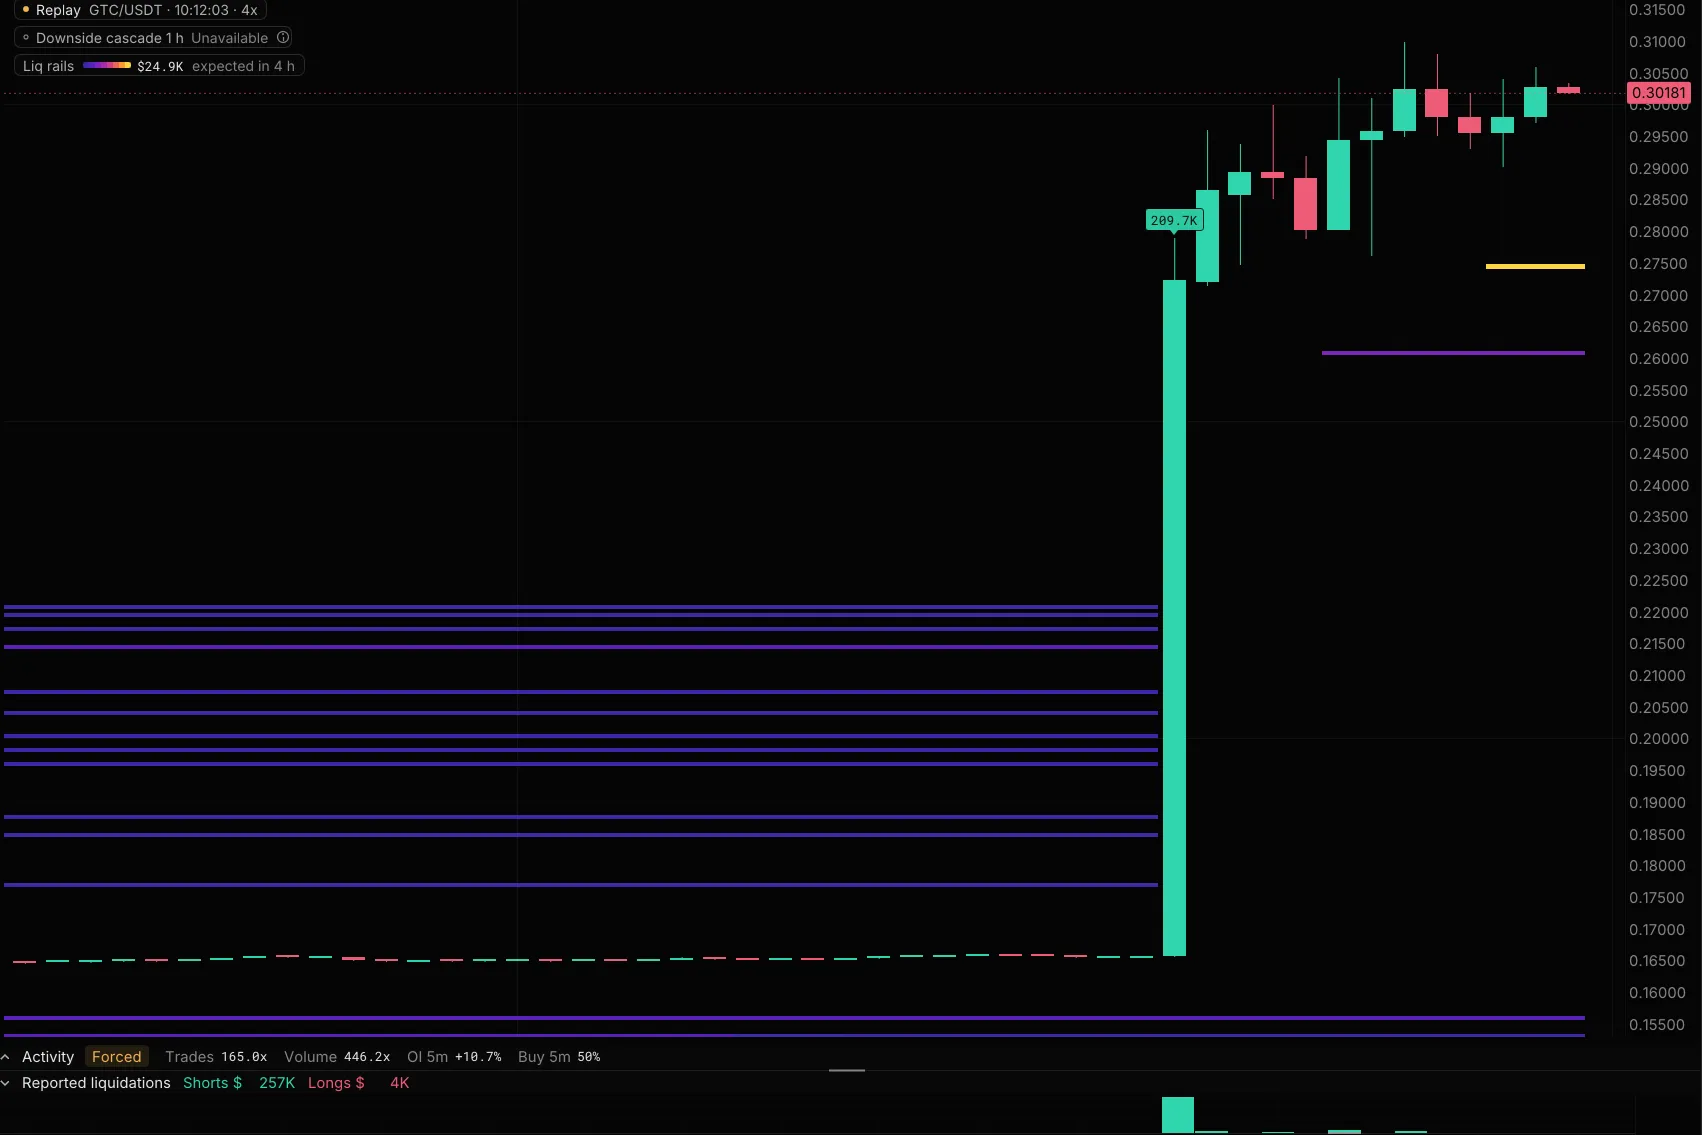
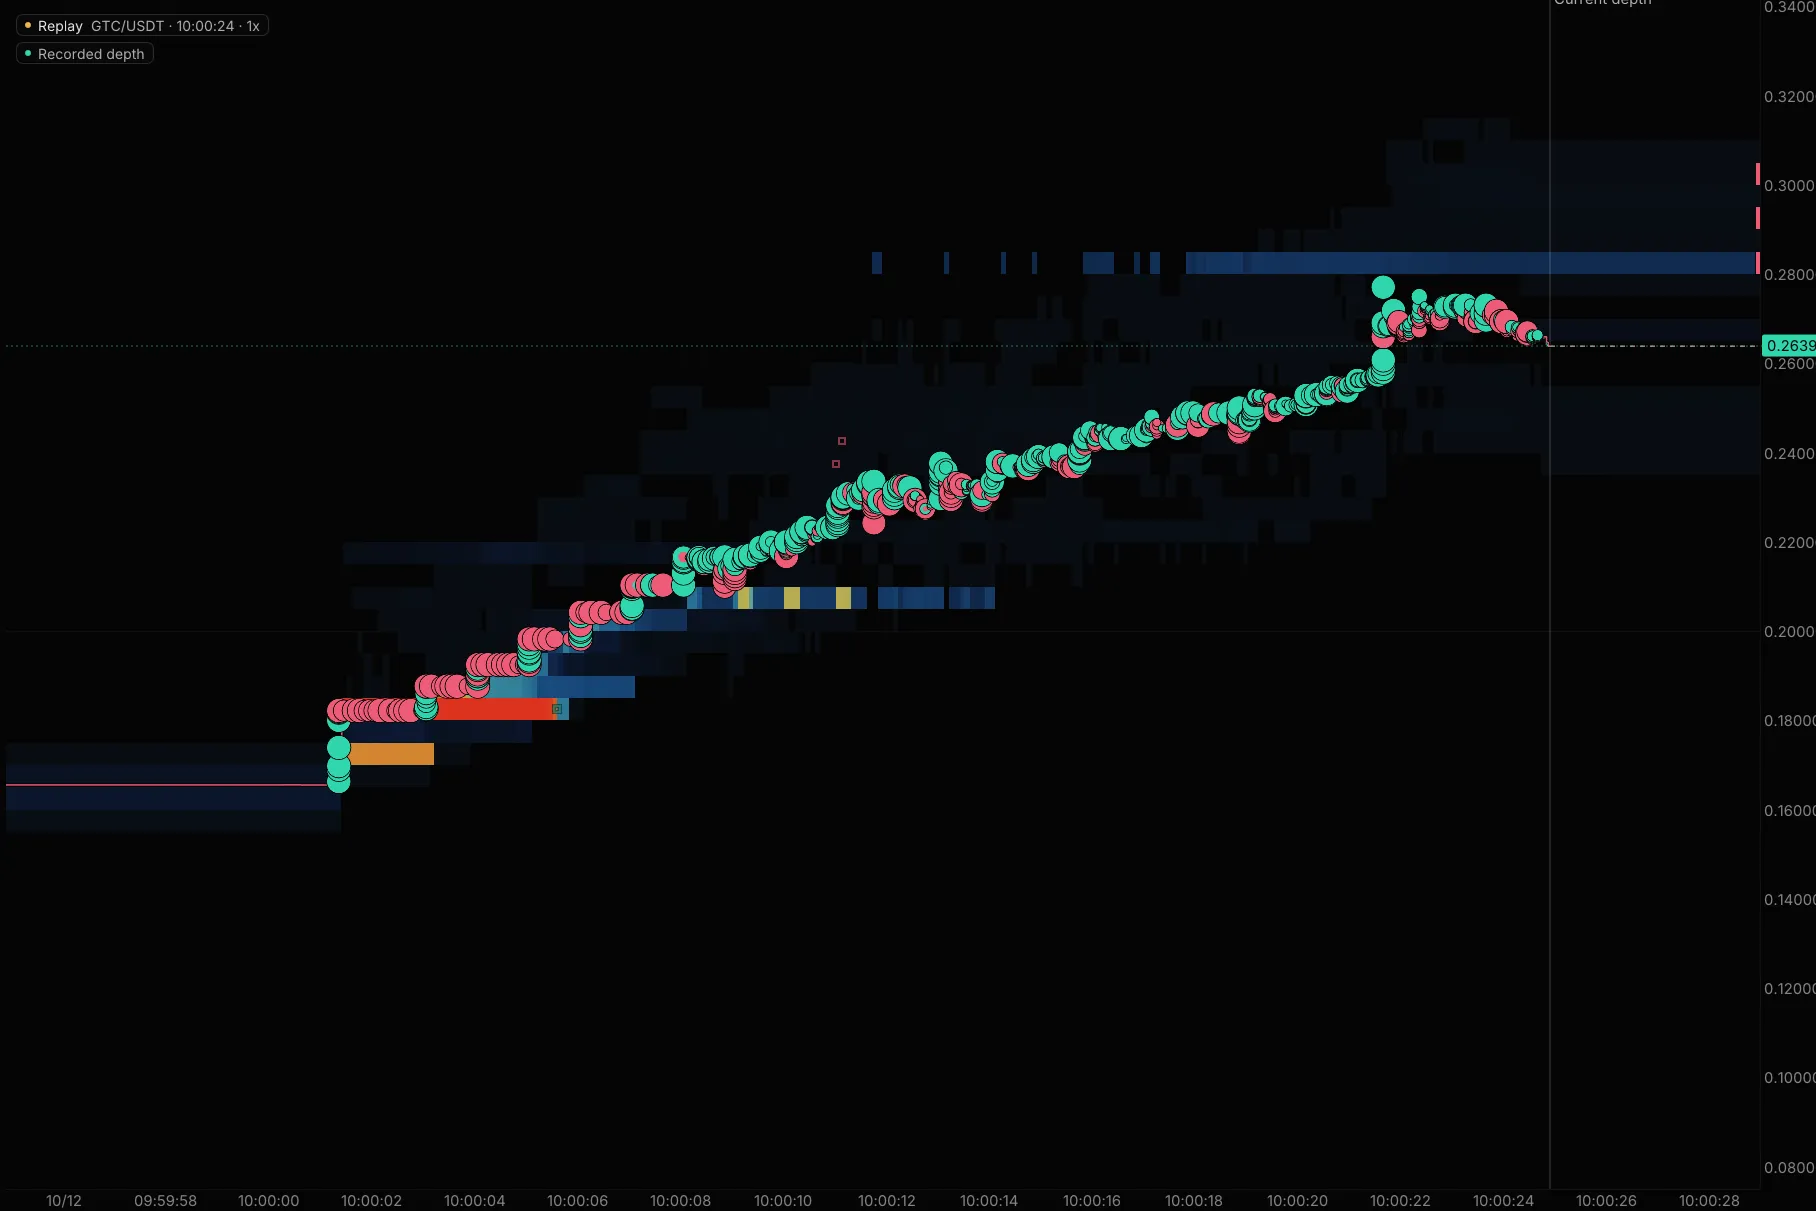
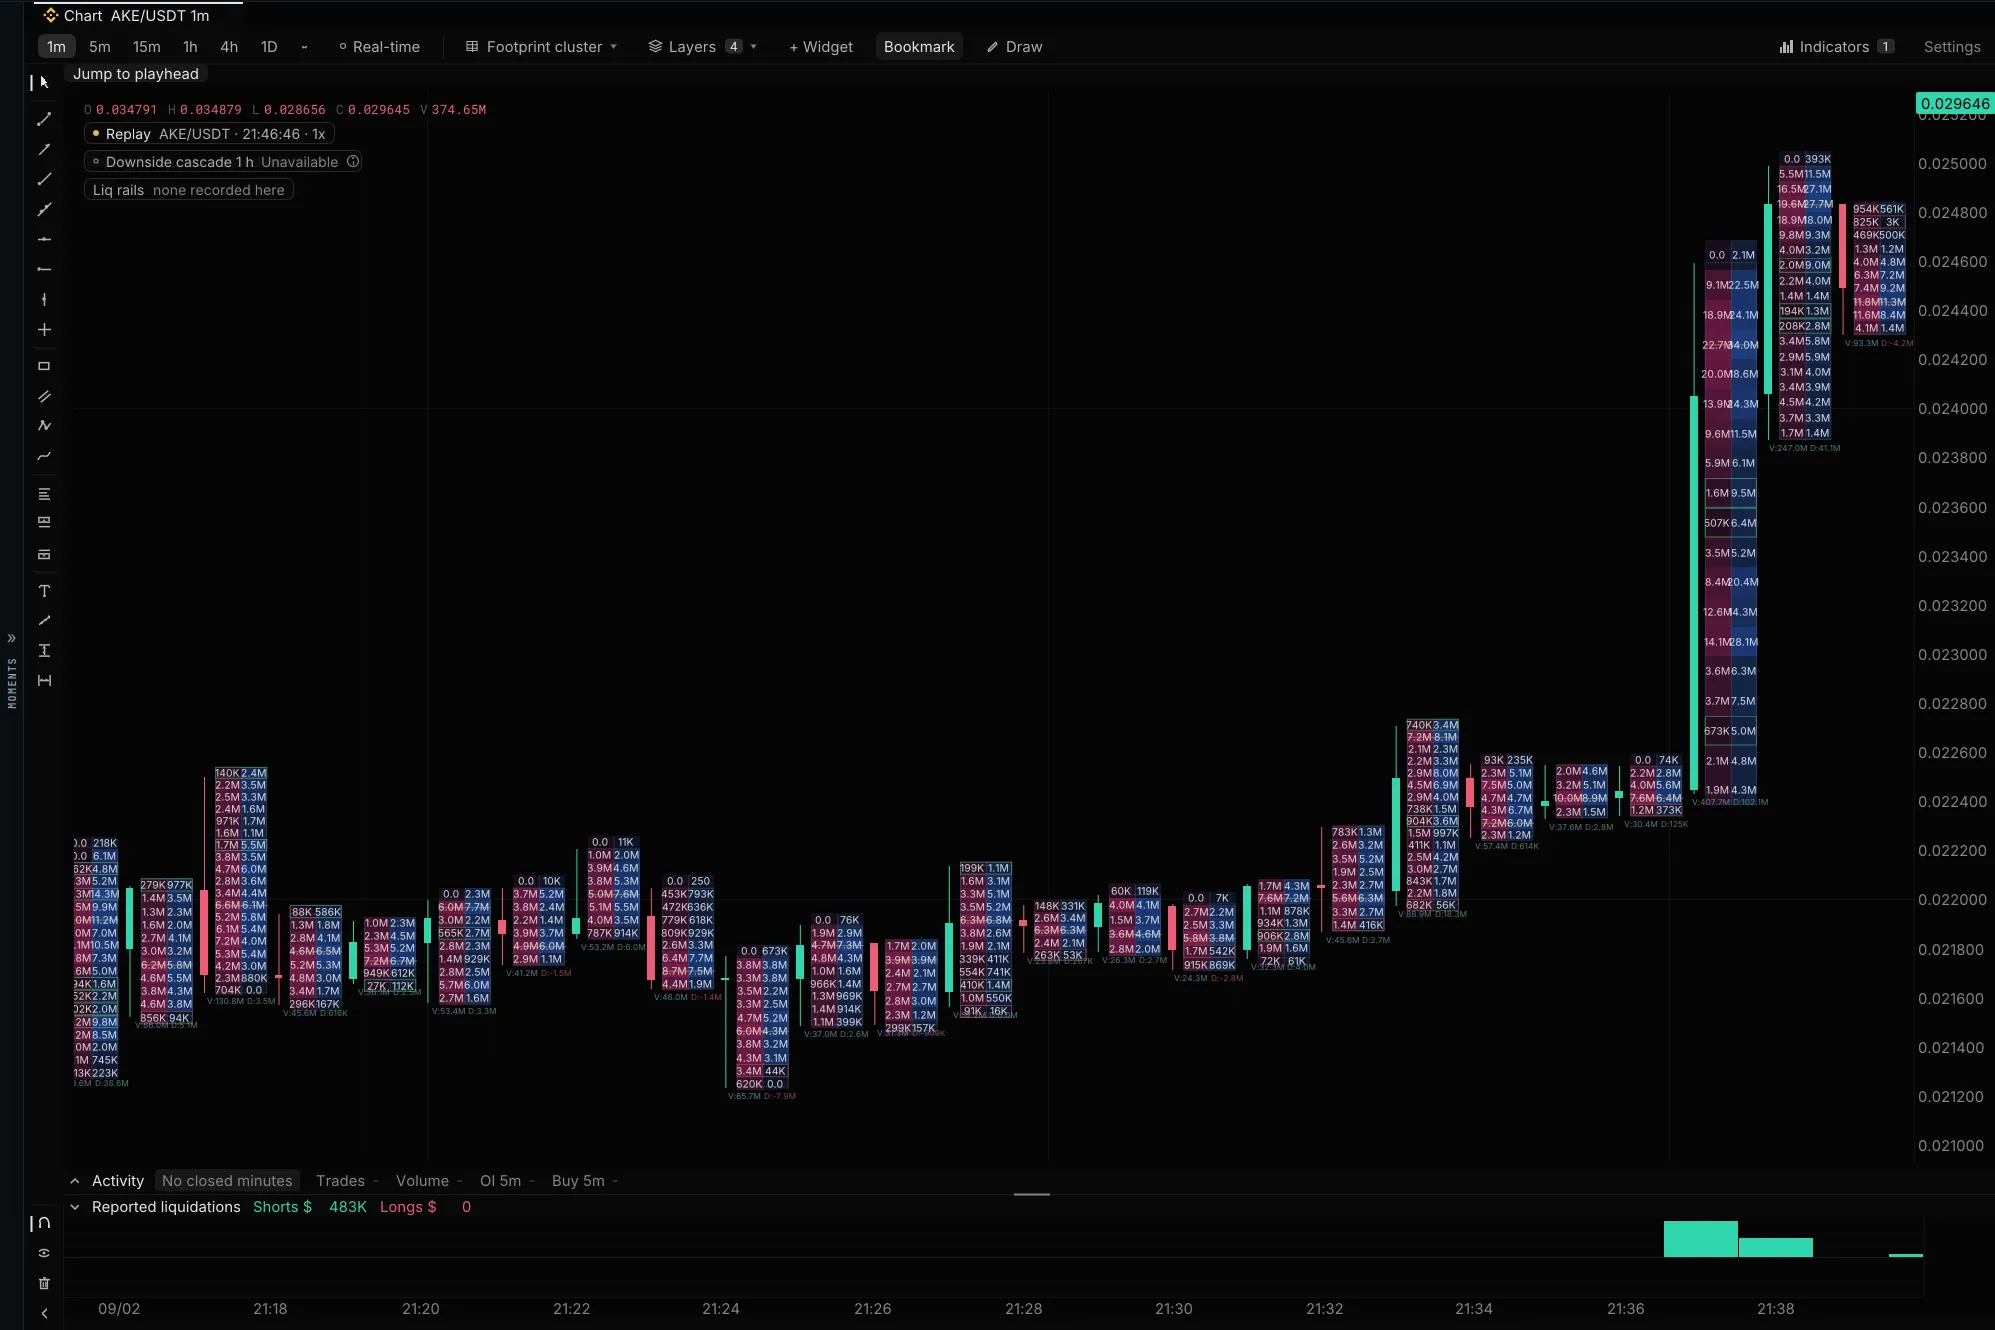
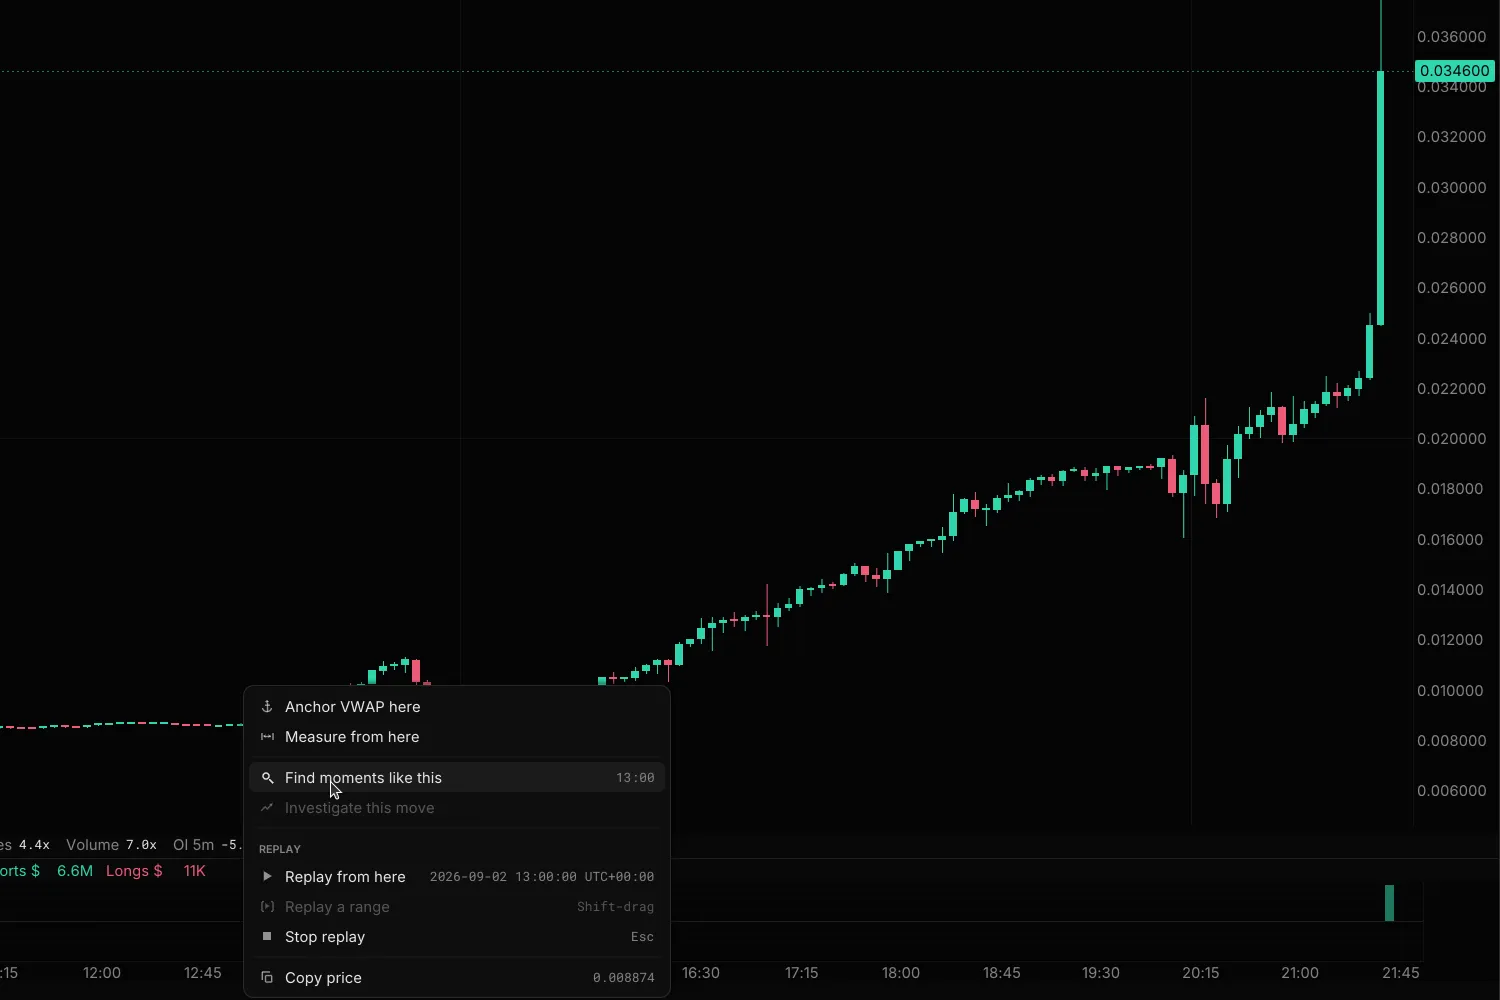









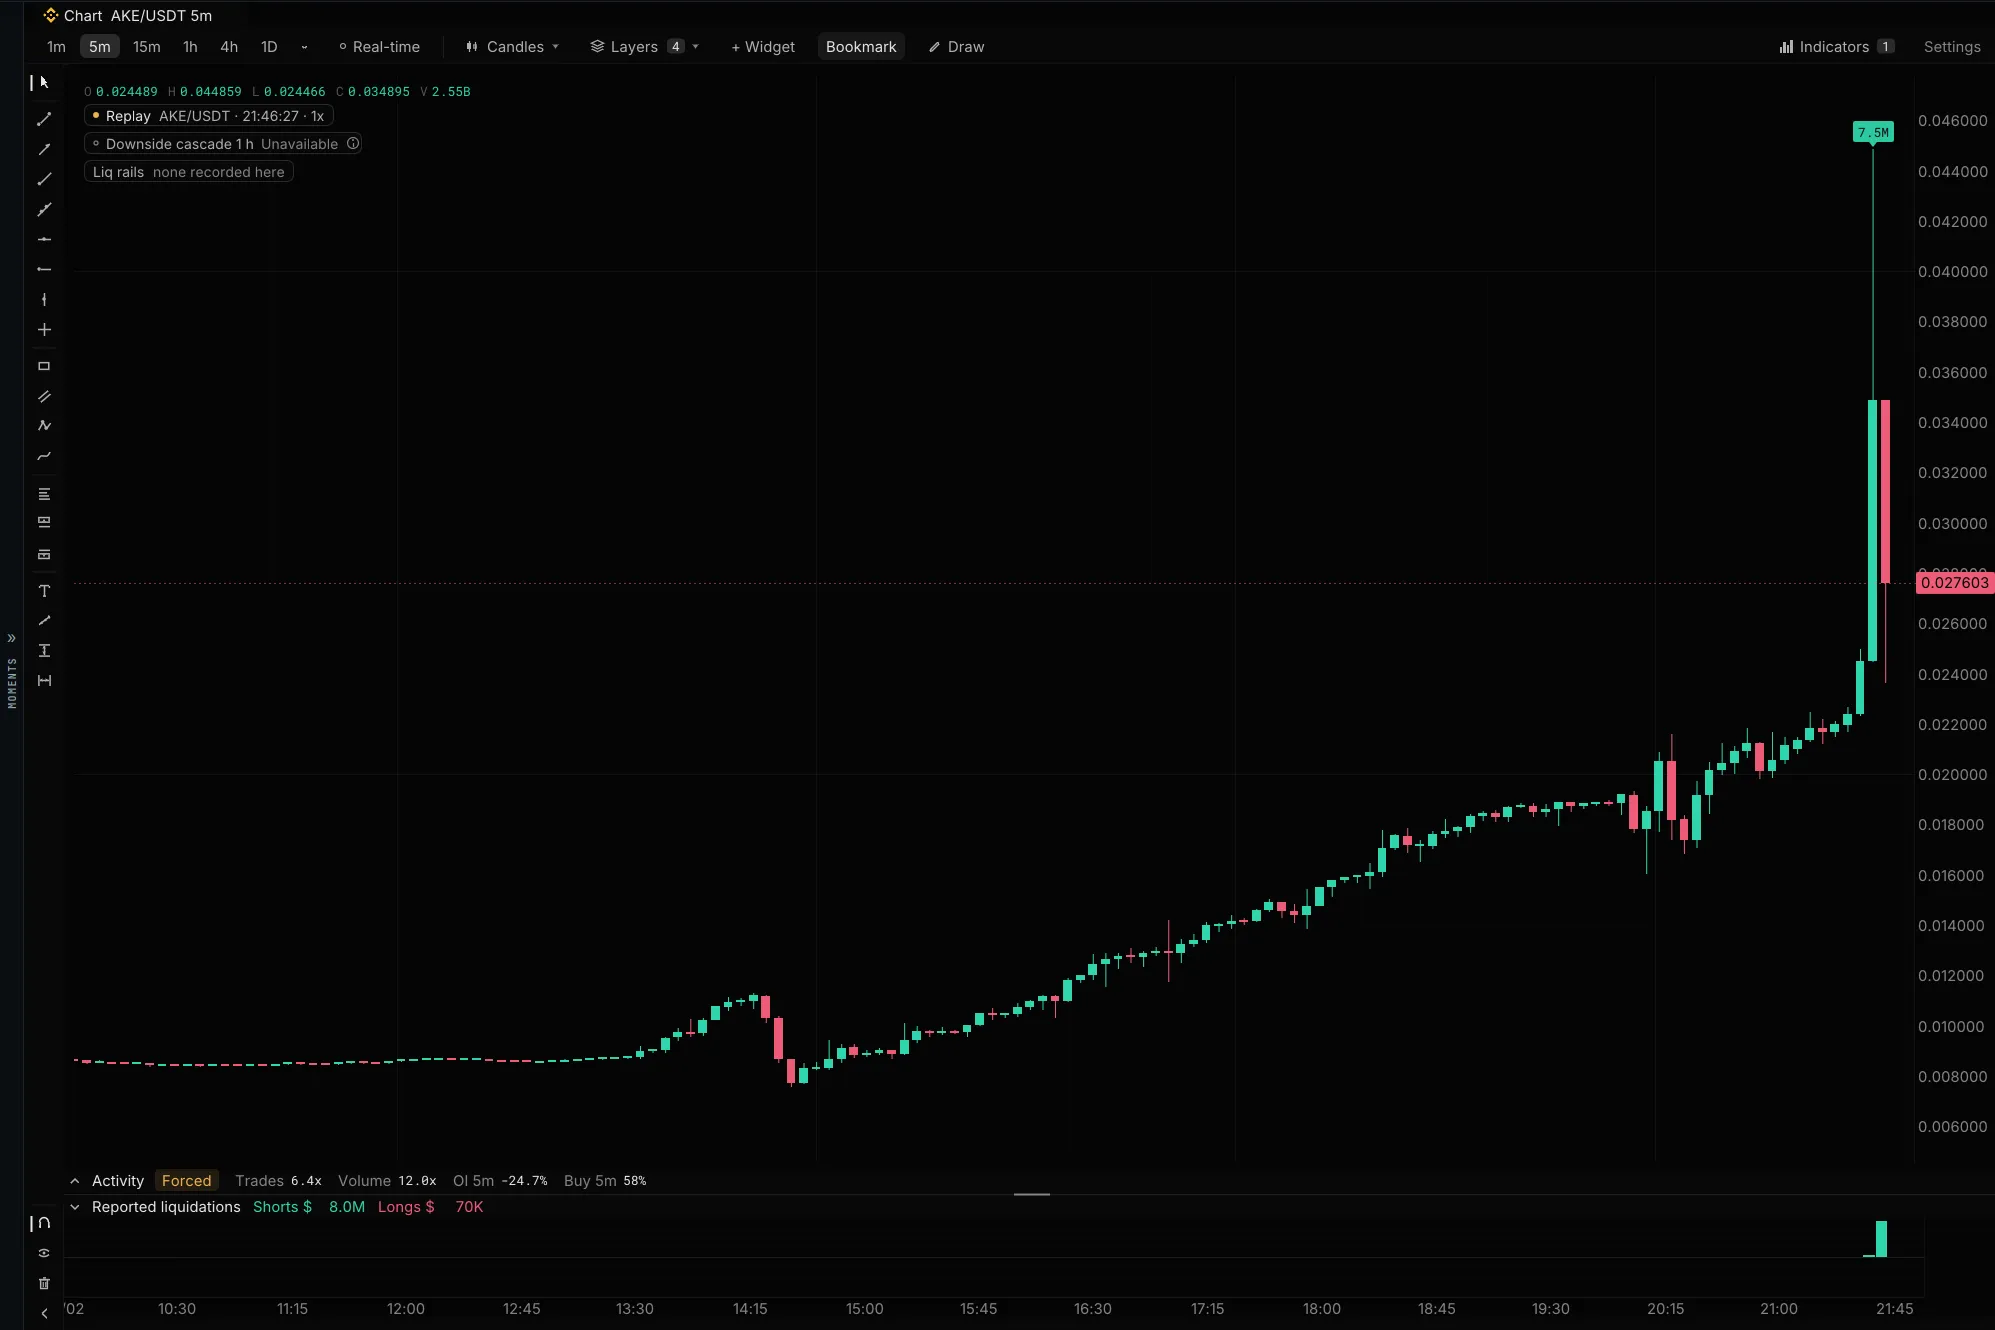
Shorts crowded a low-float name, then covered all at once: watch offers vanish as each liquidation feeds the next.
Find every match.
Replay the evidence.
Test a setup against every time it happened across 660+ recorded perp markets, then watch any of those moments replay tick by tick.
Three cherry-picked wins are not a track record.
You've seen it: the paid group with no history, the backtest screenshot cropped to the good part, the one perfect chart example. None of it tells you what happened all the other times.
EdgeDepth exists to show you all the other times.
Watch it. Rewind it. Search it.
Watch it
The full live terminal: candles, footprint, TPO, DOM, tape and liquidation layers across every Binance USDT-M pair and every Hyperliquid perp. No card.
Rewind it
We already recorded every perp, so you don't have to. Jump to any moment in the last 30 days and replay it tick by tick.
Search it
Ask the last 90 days of recorded history a question in plain English: every time it happened, what followed, and a ping when it happens again.
Ask in plain English. Get every time it happened.
Every answer shows how often it actually happened (the base rate) and how far price went against you first, so you can size from history instead of hope.
Three questions the record already answered.
PINNED RUNS · 05 JUN - 24 JUL 2026 · UTC
These are counts of what happened in the scanned window, not a promise it happens again. Nothing here is trading advice.
Built to be checked.
The honest part: this is not a signal group and nothing here predicts anything. EdgeDepth shows you what actually happened, every time, and lets you decide. It takes some work. That's the point.
We already recorded every perp. You don't have to.
Most replay tools only replay what you recorded yourself, starting the day you installed them. EdgeDepth has been recording 660+ Binance perp markets continuously: pick a coin, jump back three weeks, press play.
Prefer raw data? Download this event's full tick dataset (497 MB) →New to reading order flow? Guided lessons pause real replays at decision points and ask you to make the call. Browse guided lessons →
NO SIGNUP The moves worth studying, already cued up.
Liquidation cascades, squeezes and crashes: each one opens at the moment it started, ready to replay. Archived events stay replayable after the 30-day window has moved on.
A steady grind that flushed late shorts in waves. Study how open interest and funding built before the squeeze.
Aggressive buying accelerated into thin offers as short liquidations began reinforcing the move.
A 15-minute flash squeeze: the book thins out and the tape turns one-sided before price doubles.
The unwind after the squeeze: bids pull and long liquidations cascade the move back down.
A liquidation cascade in a high-priced perp, with $312K single prints as forced sellers hit a hollow book.
Anyone can show you one example. We show you every one.
The terminal itself is open source.
The same 180 FPS terminal behind everything above is AGPL-3.0 on GitHub, and a small MIT gateway runs it on Binance's free public data: chart, DOM ladder, tape, liquidation Field, even 1s / 5s / 15s / 30s candles built from the raw trade stream. Point it at our feed, at Binance, or at your own trading engine. Replay, research and the recorded history are what the hosted product adds.
$ git clone https://github.com/edgedepthhq/edgedepth-terminal.git
$ cd edgedepth-terminal
$ docker compose up Why we built it We got tired of tools selling predictions with nothing behind them, and of arguing from one good-looking chart. So we recorded the whole market and made it searchable.
The thesis, and who runs it →The live terminal is free. Pro rewinds 30 days. Research searches 90 days.
No auto-charge on Bitcoin · cancel anytime on card · credits are never lost
Plain answers.
How research, replay, API access and market coverage work. The long tail lives on the FAQ page.
What is EdgeDepth?
EdgeDepth answers one question: what usually happened after moments like this one?
We record 660+ Binance USDT-M crypto and TradFi perpetuals, plus every Hyperliquid perpetual, continuously. You can watch them live in a browser tab, rewind any recent moment and replay it tick by tick, or search the last 90 days of recorded history in plain English and get every time your setup occurred, what followed each time, and a replay of any of them.
It counts what happened. It never forecasts what happens next. The live view is free; the recorded history is what a subscription buys. Start with the record, or see what costs money.
Does it run in my browser?
Yes. The terminal is C++ compiled to WebAssembly and draws through WebGL2, so it runs in an ordinary browser tab: no install, no download, and the free tier needs no card.
The terminal covers what it does, and the terminal at a glance walks through the panels.
Why does every result have an ID?
So anyone can check it. Every result carries a short ID that pins exactly what was asked, which frozen code measured every value, and which state of the recorded history was scanned.
Run it again next week: same answer. Send the link to a friend: same answer. If the record has grown since, the ID says so instead of quietly changing the number. Our figures are meant to be checkable, not just quotable, and every match still opens in tick-by-tick replay so you can watch it for yourself. Determinism, explained.
What does replay actually replay?
The recorded market state, not a chart of it: individual trades, full-depth order-book updates, the DOM ladder, liquidity heatmaps, liquidations, open interest, the analytical views the terminal draws from them, and every received best-bid and best-ask price and quantity change, preserved per symbol.
Playback is deterministic, so the same recorded input rebuilds the same market sequence every time. Hyperliquid history is still being backfilled; it becomes searchable and replayable once it passes the same completeness checks as the Binance record. Starting a replay shows how to open one.
How is this different from candle replay?
Candle replay redraws bars from historical prices. EdgeDepth rebuilds the market sequence that produced those bars: the individual trades, the order-book changes as they arrived, the liquidity, the liquidations and the open interest.
You are not watching a recording of a chart. You are watching the market that drew it. Replay has the detail.
Is this financial advice?
No. EdgeDepth is market data and education. Nothing on this site or in the product is a recommendation to buy or sell anything, and no result is promised. Perpetual futures are leveraged instruments and carry a substantial risk of loss.
Counts describe what the record contains. They are observed history, never a forecast, and what you do with them is your decision. The disclaimer is the formal version.
Is EdgeDepth finished? What does early access mean?
The EARLY ACCESS label means the product is real and usable today: the search engine, the public API, the read-only MCP server, the live terminal, 30-day tick replay and the event archive are all live. What is still moving is the surface around them.
It does not mean the recorded market data is experimental. Capture is lossless, replays are deterministic, and archived events stay replayable. Founder pricing is available during this stage and is held while your subscription stays active.
The roadmap says what is live, what is rolling out, and what is only being explored.
Stop guessing from examples.
Search 90 days of what happened.
Describe the setup once. See every time it happened, what followed, and replay any of them.